
Creating Accessible Tables
Creating Accessible Tables
Tables should be used to present data in rows and columns, not to control page layout. In accessible tables, row and column headers must be clearly identified so screen readers can correctly interpret relationships between header cells and data cells.
Note to Reader: Audio-described version of the video. Use player controls to play, pause, or adjust volume.
Learning Objectives
By the end of this chapter, you should be able to:
- Explain why tables should be used for data rather than layout.
- Identify the steps needed to create accessible tables in Canvas.
- Mark a table header row in the Canvas Rich Content Editor.
- Assign header cell types and scope values to row and column headers.
- Evaluate tables for common accessibility issues before publishing.
Key Terms
- Accessible table: A table that uses proper structural markup so assistive technologies can interpret relationships between headers and data cells.
- Header row: The row that contains labels describing the content of each column.
- Header cell: A table cell marked as a header.
- Scope: An attribute that identifies whether a header cell applies to a row or column.
Chapter Overview
This chapter explains how to create accessible tables in Canvas by identifying header rows and header cells. You will learn the two main steps for improving table accessibility in the Canvas Rich Content Editor and review why header structure matters for users of assistive technology.
Why Accessible Tables Matter
Screen readers rely on table markup to announce headers along with the corresponding data. When tables are built only for visual appearance, or when headers are not properly identified, the content can become confusing or unusable for readers who depend on assistive technology.
Accessibility Check
Use tables only for data. If you are arranging content for visual layout, use headings, paragraphs, and lists instead of a table.
Techniques for Accessible Tables in Canvas
To make a table accessible in a Canvas page, complete these two steps in the Rich Content Editor.
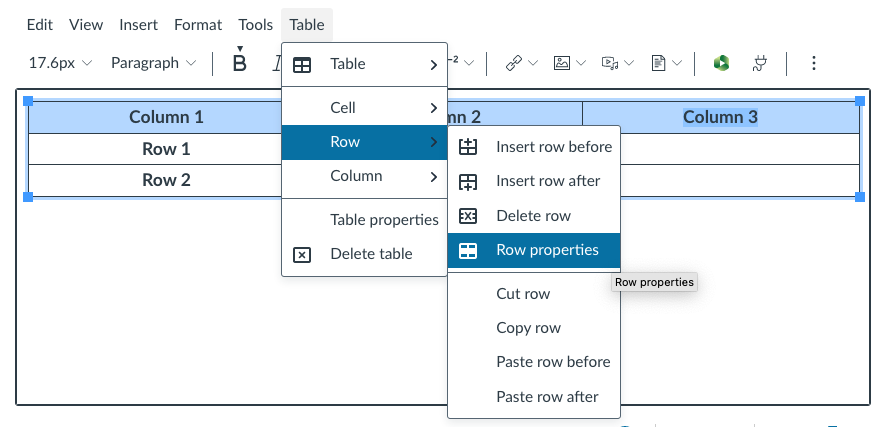
Step 1: Identify the Header Row
- Select the table in the Canvas editor.
- Choose Table > Row > Row Properties.
- Set the Row type to Header.
- Save your changes.
Tip
Start with the top row if it labels the columns.
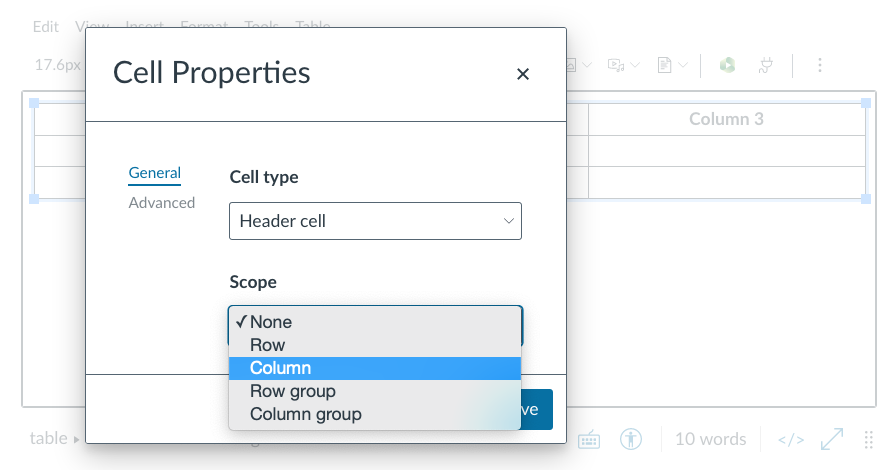
Step 2: Identify Header Cells
- Select a header cell.
- Choose Table > Cell > Cell Properties.
- Set the Cell type to Header.
- Set Scope to Column or Row.
- Save your changes.
Accessibility Reminder
Do not rely on bold text alone to indicate headers. Use table properties so assistive technologies can interpret the structure.
Accessible Tables in Microsoft Word
If you create tables in Microsoft Word before uploading them to Canvas or converting them to PDF, you must ensure that the header row is properly identified. This helps assistive technologies correctly interpret table structure.
Repeat Header Row in Word
- Select the table properties
- Go to the Row tab.
- Check the box, Repeat as header row at the top of each page.
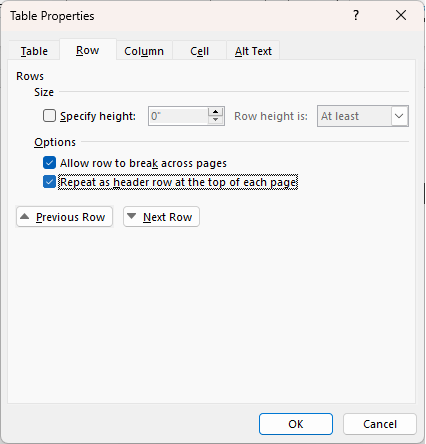
This ensures that the header row is recognized as a header and repeated across pages when the table spans multiple pages. More importantly, it helps screen readers associate header cells with the correct data.
Accessibility Check
- Is the header row identified using Repeat Header Rows?
- Are column labels clear and descriptive?
- Does the table maintain structure when exported to PDF or HTML?
Tip
Applying “Repeat Header Rows” in Word improves accessibility when documents are shared or converted, even outside of Canvas.
Chapter Summary
Chapter Summary
Accessible tables require proper structure, including header rows and header cells with defined scope. These steps ensure that screen readers can correctly interpret relationships between data.
Key Takeaways
- Use tables only for data.
- Mark header rows and header cells.
- Apply scope to clarify relationships.
- Check accessibility before publishing.
Practice Activity
Open a Canvas page with a table. Identify the header row and apply header cell formatting and scope. Test the table using the Accessibility Checker.
Further Reading
Licenses and Attribution
CC Licensed Content, Original
This educational material includes AI-generated content from ChatGPT by OpenAI. The original content created by Josh Hill, Neida Abraham, and Emiliana Olavarrieta from Hillsborough College is licensed under a Creative Commons Attribution-NonCommercial 4.0 International License (CC BY-NC 4.0).
All images in this textbook generated with DALL·E are licensed under the terms provided by OpenAI, allowing their use, modification, and distribution with appropriate attribution.
Third-Party Platforms and Interfaces
This chapter includes screenshots of third-party software and web interfaces, including Canvas, for purposes of instruction, commentary, and accessibility training. These screenshots are used to document a workflow and remain subject to the terms, policies, and rights associated with the respective platforms.
Standards and Guidance
This chapter discusses accessible table structure in Canvas and refers readers to web accessibility tutorials, table accessibility guidance, and testing guidance for identifying common table issues.
References
- Deque University. (n.d.). Table accessibility guidelines.
- OpenAI. (2022, November 30). Introducing ChatGPT.
- WebAIM. (n.d.). Creating accessible tables.
- World Wide Web Consortium, Web Accessibility Initiative. (n.d.). Tables tutorial.
Other Licensed Content
How to Create an Accessible Table in Canvas
Sierra College Distance Learning
License: Standard YouTube License.
